What are we talking about here? Link to heading
When one is training a model, one typically engages in a process called “hyperparameter tuning.” The model is trained many (10s, 100s, or 1000’s of) times, varying some of the inputs. This could be as simple as the number of epochs, or, could be as varied as taking different slices or ranges of input data (ie: different sensors from an array of many sensors, etc), different ML model structures, or, different parameters within that structure.
Along the way, you log your results - what parameters were used as well as the training metrics themselves.
Once you’re done, you may like to analyze this data to see which parameters actually matter, which parameter range(s) are appropriate.
ML the ML Link to heading
We as data scientists can, and should use ML to analyze such results of our ML training.
So meta.

Tracking the experiments using MLFlow Link to heading
Instrument your training function:
import mlflow

mlflow.set_experiment("2024_01_17_some_experiment")

def train_with_params(field_indexes, num_epochs, hidden_size, hidden_size2, hidden_size3, batch_size, pre_samples, post_samples):
    with mlflow.start_run(nested=True) as run:
        value = mlflow.log_param("field_indexes", field_indexes)
        value = mlflow.log_param("num_epochs", num_epochs)
        value = mlflow.log_param("hidden_size", hidden_size)
        value = mlflow.log_param("hidden_size2", hidden_size2)
        value = mlflow.log_param("hidden_size3", hidden_size3)
        value = mlflow.log_param("batch_size", batch_size)
        value = mlflow.log_param("pre_samples", pre_samples)
        value = mlflow.log_param("post_samples", post_samples)

        ... load data, setup your net, etc ...

        for epoch in range(num_epochs):
            train_loss = train(...)
            val_loss, val_accuracy = evaluate(...)
            mlflow.log_metric(key="train_loss", value=train_loss, step=epoch)
            mlflow.log_metric(key="val_loss", value=val_loss, step=epoch)
            mlflow.log_metric(key="val_accuracy", value=val_accuracy, step=epoch)
Later, we can then load the data from all the runs with that experiment name:
df = mlflow.search_runs(experiment_names=["2024_01_17_some_experiment"])
and we get a dataframe with all our params/metrics logged for each run.
Which parameters are useful? Link to heading
# use random forest to figure out the most important parameters

import pandas as pd
import numpy as np
from sklearn.ensemble import RandomForestRegressor
import matplotlib.pyplot as plt
import seaborn as sns

runs_df = runs_df.dropna()

# Step 2: Train a Random Forest model
X = runs_df[['params.post_samples', 'params.pre_samples', 'params.hidden_size','params.hidden_size2','params.hidden_size3','params.field_indexes_encoded']]
y = runs_df['metrics.val_accuracy']
model = RandomForestRegressor(n_estimators=100)
model.fit(X, y)

# Step 3: Extract and visualize feature importance
feature_importance = model.feature_importances_

# Create a bar plot for feature importance
plt.figure(figsize=(15, 6))
sns.barplot(x=['params.post_samples', 'params.pre_samples', 'params.hidden_size','params.hidden_size2','params.hidden_size3','params.field_indexes_encoded'], y=feature_importance)
plt.title('Feature Importance in Predicting Accuracy')
plt.xlabel('Features')
plt.ylabel('Importance')
plt.show()
This gives us a nice plot:

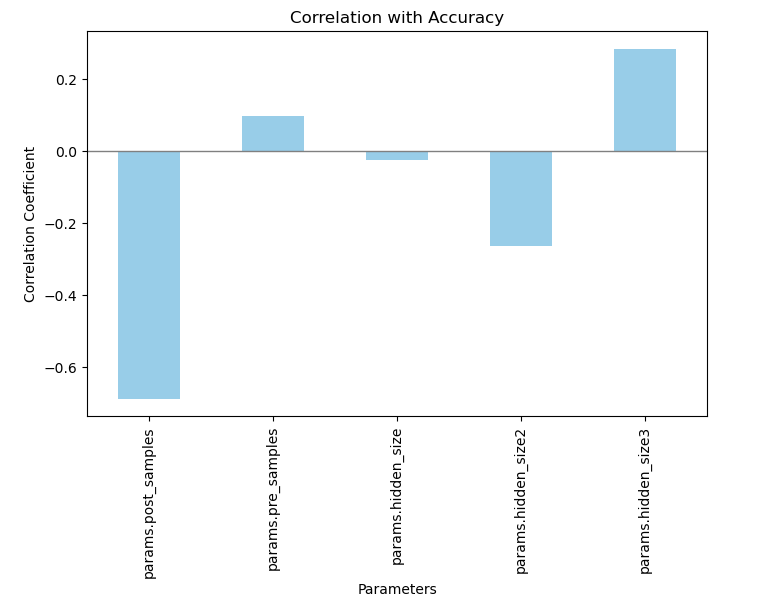
Is a higher or lower value for a certain parameter better or worse? Link to heading
# Calculate the correlation coefficients
correlation_matrix = runs_df[['metrics.val_accuracy','params.post_samples', 'params.pre_samples', 'params.hidden_size','params.hidden_size2','params.hidden_size3']].corr()
# Extracting the correlations with 'accuracy'
accuracy_correlations = correlation_matrix['metrics.val_accuracy'].drop('metrics.val_accuracy')  # exclude the correlation of accuracy with itself

plt.figure(figsize=(8, 5))
accuracy_correlations.plot(kind='bar', color='skyblue')
plt.title('Correlation with Accuracy')
plt.xlabel('Parameters')
plt.ylabel('Correlation Coefficient')
plt.axhline(0, color='grey', lw=1)  # Add a line at y=0 for reference
plt.show()
This gives us a nice plot:
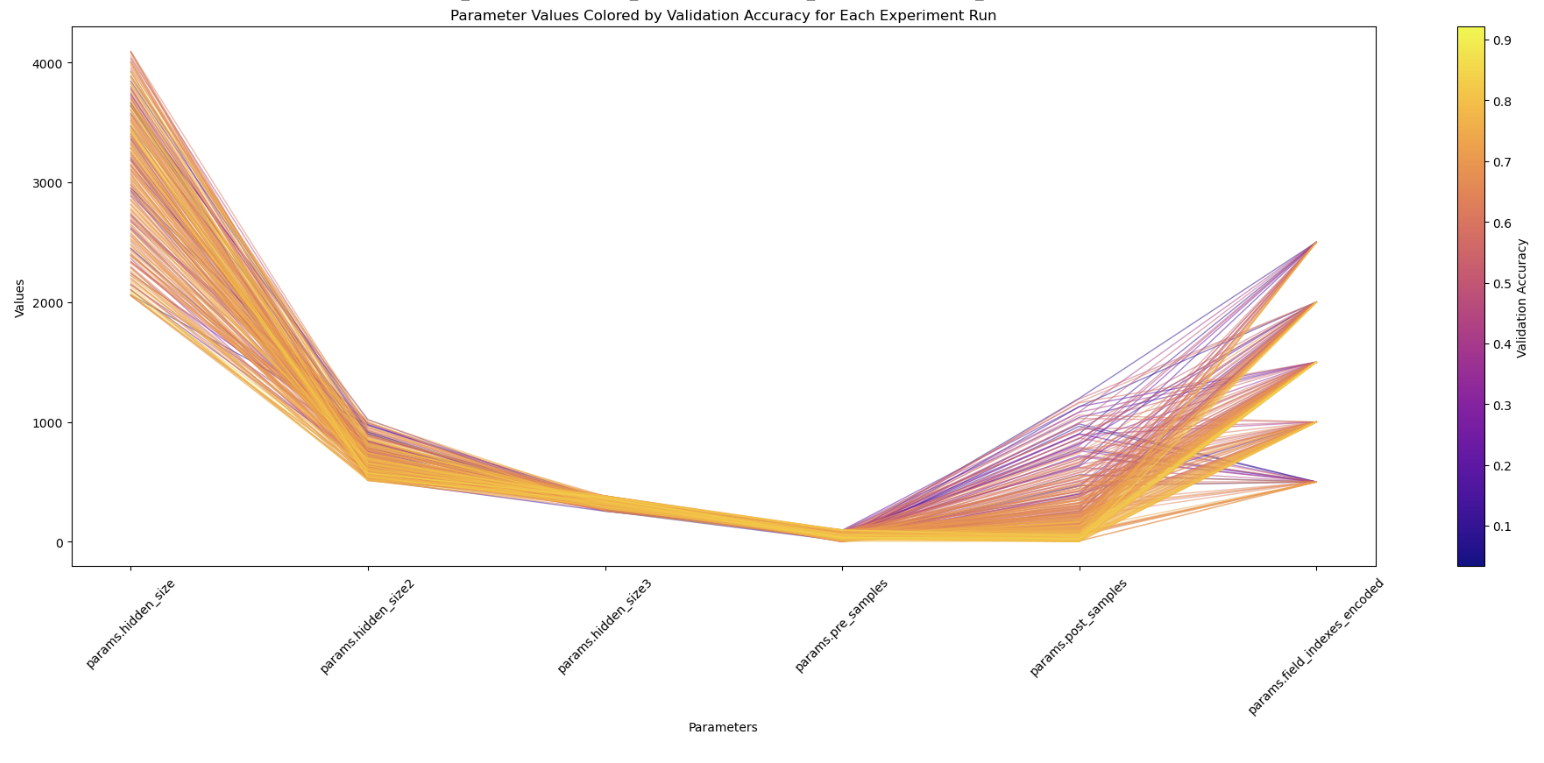
Help me SEE what is going on Link to heading
from matplotlib.colors import Normalize
# Converting parameters to numeric values
param_columns = ["params.hidden_size", "params.hidden_size2", "params.hidden_size3", "params.pre_samples", "params.post_samples",'params.field_indexes_encoded']
runs_df[param_columns] = runs_df[param_columns].apply(pd.to_numeric)

df_sorted = runs_df.sort_values(by='metrics.val_accuracy',ascending=True )

# Visualization
plt.figure(figsize=(24, 8))

# Plotting each experiment run
for i in range(df_sorted.shape[0]):
    plt.plot(param_columns, df_sorted.iloc[i][param_columns], color=plt.cm.plasma(df_sorted.iloc[i]['metrics.val_accuracy']), alpha=0.5, linewidth=1)

plt.title('Parameter Values Colored by Validation Accuracy for Each Experiment Run')
plt.xlabel('Parameters')
plt.ylabel('Values')
plt.colorbar(plt.cm.ScalarMappable(norm=Normalize(df_sorted['metrics.val_accuracy'].min(), df_sorted['metrics.val_accuracy'].max()), cmap='plasma'), label='Validation Accuracy')
plt.xticks(rotation=45)
plt.show()
This gives us a nice plot:
Summary Link to heading
These are only a few ways we can look at our ML training results, and derive insights about how to train better, and get that accuracy higher!
I look forward to any suggestions the community may have on how they asses ML experiment data, and decide which hyperparams to tune, and how.